Traffic Viewer
The Traffic Viewer can be used in all steps of ECU development to capture communication data report to verify individual development steps, check prototypes or execute regression and conformity tests. It allows the user to observe, log and evaluate the data flow on a selected data source. The following are some of its various features included:
Simultaneous capture of live messages of the vehicle communication network and show them decoded in the GUI.
Display of CAN, FlexRay, MOST, LIN and Ethernet messages with very detailed information.
Support of databases files for analysis of data content such as signals.
Support of many Ethernet protocol decoders (UDP, TCP, DoIP, IEEE1722, SOME/IP, PTP, ...).
Opening trace files (ASCII, PCAP and VPCAP).
Filtering the traffic.
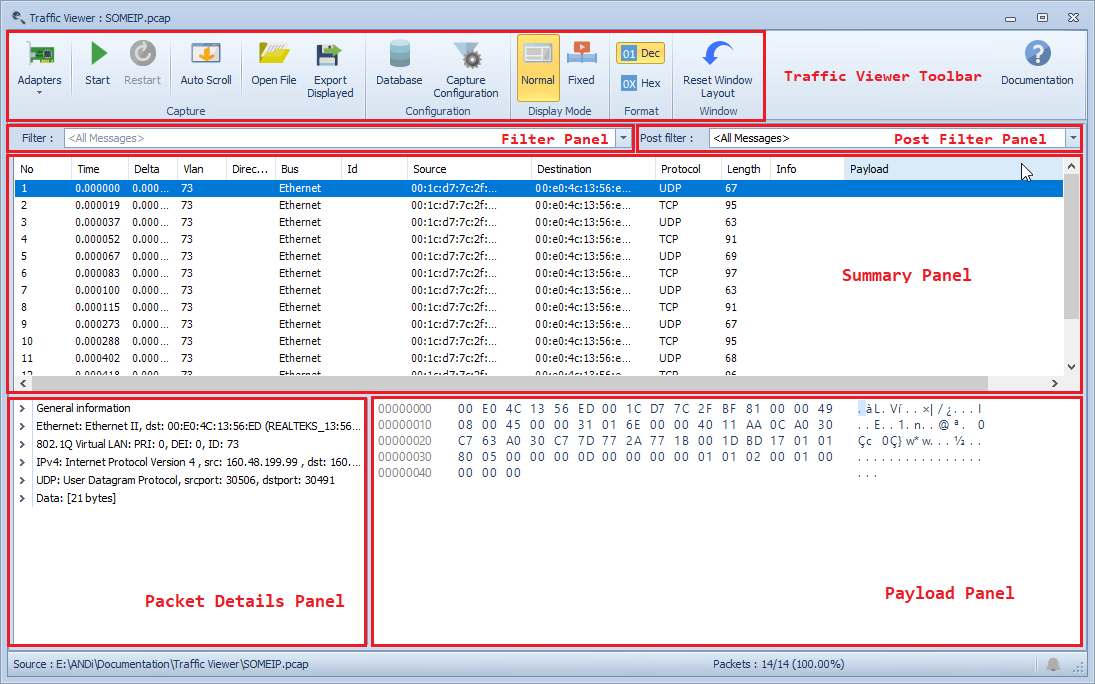
The Traffic Viewer main window contains the following items:
Tip
- The Traffic Viewer is designed to handle large files:
Over 16 million packets for a PCAP files (between 1GB and 20GB depending on average packet size).
Over 7 million frames for ACSII files.
Larger files should work but not tested.
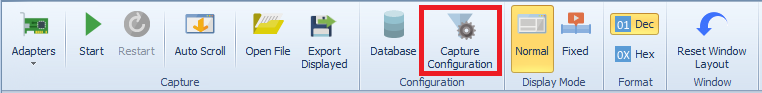
Toolbar
The Traffic Viewer toolbar provides controls for starting and stopping a Traffic Viewer session, open file, export displayed data, configuration of database mapping, configuration of Npcap filter and choosing between normal mode or fixed mode to display.
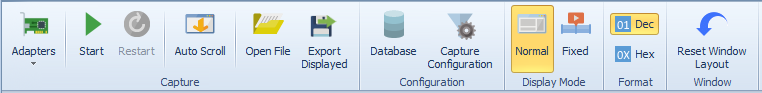
Adapters displays the configured channels and allows to configure channels from a drop down list of the connected Hardware Interfaces such as: Ethernet Adapters, Vector Hardware and Technica Engineering Hardware.
Start/Stop starts a capture on the selected channels or stops a currently running capture.
Restart restarts a capture on the selected channels. A question is displayed if the user want to export current packets before restarting.
Auto Scroll the scroll is done automatically while the capture is in progress. we can activate or deactivate it.
Open File opens PCAP, PCAPNG, VPCAP, MDF or ASCII file.
Export Displayed exports current packets captured, if we have filter only the filtered data is exported.
Database opens a dialog for specifying the channel bus mapping or databases to be supplied with data.
Capture Configuration configures the filter of the next capture.
Normal displays the normal mode of Traffic Viewer.
Fixed displays the Fixed mode of Traffic Viewer.
Dec displays numeric columns values on Decimal format.
Hex displays numeric columns values on Hexadecimal format.
Reset Window Layout allows resetting the settings to their installation values.
Normal Mode
The normal mode is displayed by default when you open the Traffic Viewer. It allows you to visualize all the recorded frames, and gives you the possibility to use a filter if you need.
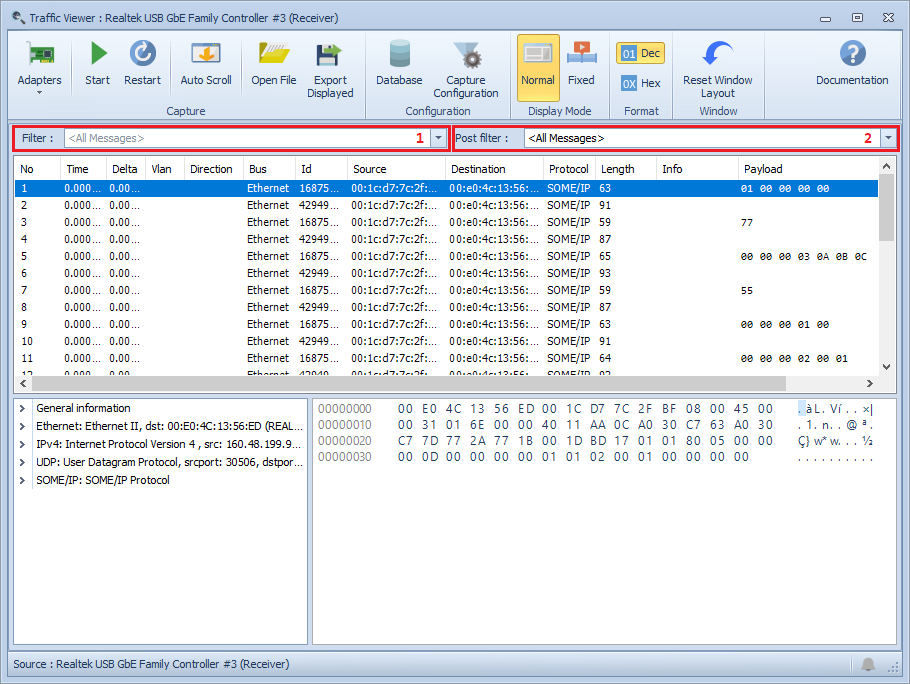
1. Filter Panel
2. Post Filter Panel
To get an accurate filtering result for a concerned delta, you just have to put the right delta filter expression in the post filter panel and press the Enter button (note that this filter also supports the same syntax as the regular filter as well as the special field delta).
Fixed Mode
The fixed mode allows you to see all the frames without duplication and with message counter. The essential purpose of this mode is to filter packets by Id to show you the last received ones.
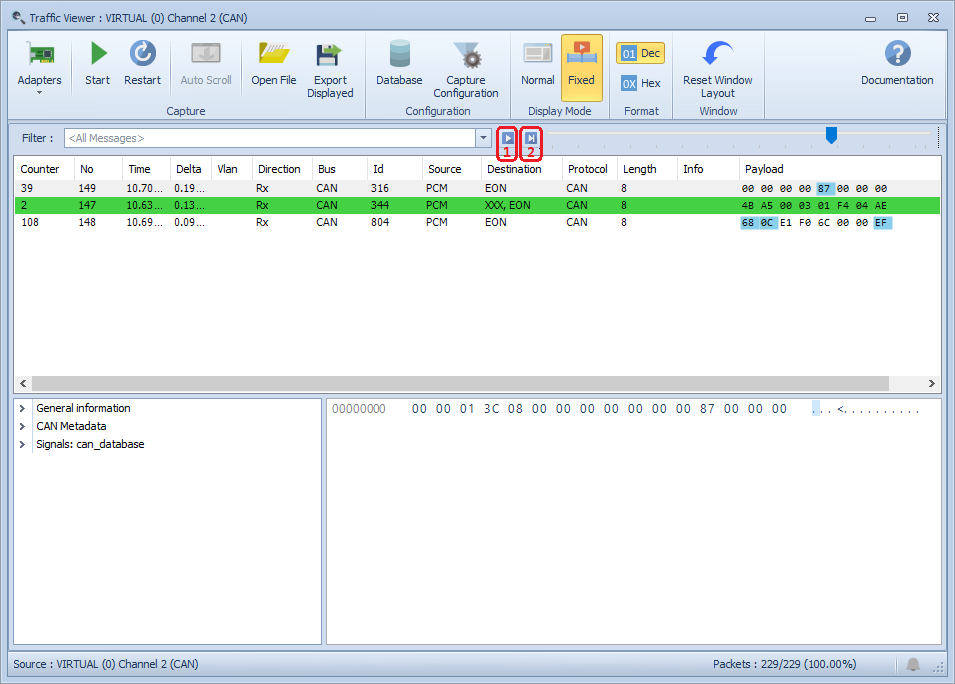
1 Shows the packets received from time 0 until the displayed time on the scroll bar. A click on the button makes a switch from real time mode of received packets to a static time mode, and you can move the scroll bar to fix the time you need.
In this case Traffic Viewer will show the packet's payload as it changes (E.g: CRC and Alive for message CAN which are auto calculated in the payload).
2 Go to the end to show all the received packets at the last moment.
Save the interface settings
Summary Panel
The summary panel displays and provides information about the captured messages (live or from a file) in a data grid.
The summary panel displays the packet list from an online capture file or from a saved one (PCAP). Every line in the summary panel represents a packet in the master grid. A double click on the selected line will display the Packet details and the Packet bytes' panel. You can also scroll through the master grid to see the details for each packet.
In addition to the two previous methods, it is also possible to get the packet details through the details panel by selecting the right packet. While dissecting a packet, you will typically see the information from the highest possible level only as higher level protocols might overwrite information from lower levels.
The summary panel represents various managed interfaces to ensure a variety of functions. These interfaces are indicated and explained in the following figure.
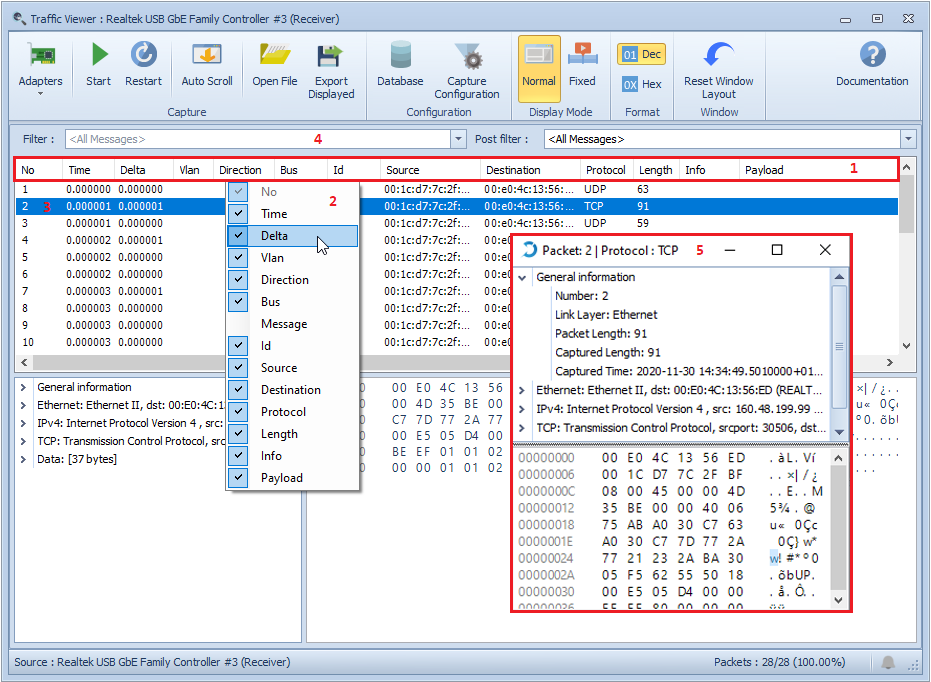
Grid menu, provides menu options for Grid Views.
Column headers, enable the user to get the context menu for column customization with right click.
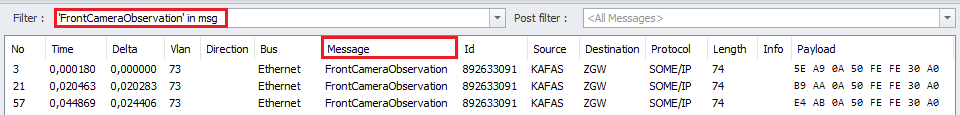
Message column is hidden by default and can be activated using the column header context menu, it shows the message name when the appropriate database is attached to the message.
A filter can then be added using the message name: frame.message =='message_name'.
User can reorder the columns, with the exception of the No and Counter (in fixed view) columns which are locked.
Click into any line enable the user to see details of master rows. When a master row is selected, a detail view is displayed.
Filter panel appears by default at the bottom of a view if a filter has been applied.
Detail grid provides the detail grid for the selected packet.
Note
The first layer shown for each message is the only field not actually found in the message itself. Instead, this special layer contains various information about the message as a whole when it was captured. For instance, its number, length, etc.
Ethernet messages case: shows the protocols and protocol fields of the message. The layers of the packet are arranged with the lowest protocol layer at the top of the panel and then work their way up to the highest protocol layers. You can open each of the layers to see the various fields in the packet decoded into natural language.
Signals contained in the message are only shown if an appropriate database has been loaded.
Payload Panel
Displays the data of the current message selected in the summary panel in a hex dump style.
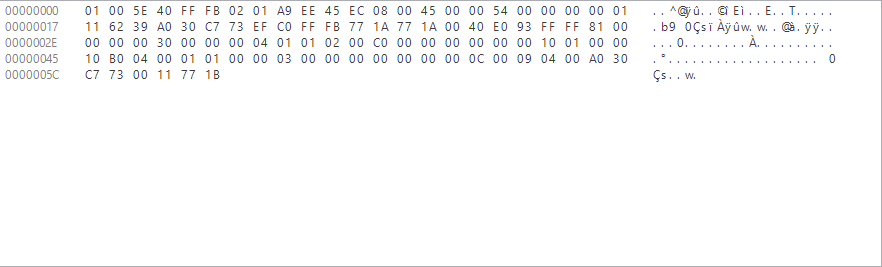
As usual for a hex dump:
the left side shows the offset in the message data.
the middle side shows the message data in a hexadecimal representation.
the right side shows the corresponding ASCII characters (or . if not appropriate).
Packet Details Panel
Dissects and displays the details of the current selected message in the packet details panel in tree-list style. Each tree-list element points at its value in the payload panel and provides an interpretation, if possible, of that value.
Configuration Filter
This enables filtering packets that are being accepted in the Traffic Viewer (on the hardware level).
This configuration is supported in both modes (Normal and Fixed).
You need to Stop and Start a new capture or open a new pcap file to take the Filter Configuration changes into consideration.
After entering the desired filter configurations, clicking on button "OK" will apply these filters to the current instance of Traffic Viewer.
The user can save the content of "Capture Configuration" after a click on button called "Set as default". Once done, the configuration will be saved for the next open of Traffic Viewer.
Auto Depacketize TECMP option: determines whether or not to automatically split TECMP packetized frames into separate frames. This option, if not introduced in other components, means that TECMP frames are automatically depacketized.
Packets Filter
The filter has three parts:
Capture Filter
Npcap Capture Filter configuration allows you to specify a complex filter criteria. It allows you to filter frames you are interested in and discard uninteresting ones.
Important
Filter syntax is accessible in PCAP_Filter.
Vlan Support
You can specify if you need packets with vlan or not by choosing TRUE or FALSE in Vlan Support field.
Gateway Port Filter
Gateway Port Filter allows the specification of port ranges that are usable while filtering packets.
When filtering a packet, if the gateway port value does not match the filtered ports it will be discarded.
Important
- Gateway Port Filter syntax is as follows:
Port Filter items separated by commas. Example 1, 2
Items could be single port numbers or ranges (range is two numbers separated by dash). Example 1, 2, 5-9
Port filtering supports reception ports (Rx) and transmission ports (Tx)
Values could be either decimal or hexadecimal. Example 1, 0x05, 5-0x09
Spaces are allowed between an item and a comma, or an item and a dash, For example 1, 2, 4 - 5 is correct but 1,4 5 is wrong
Note
When working with gateways (BRSpy or Capture Module for example), if present, the filter will handle the encapsulated Ethernet packet and not the Raw packet.
Note
- The supported gateways and their ether types are:
BR-SPY ETH Wrapper (0x2082)
BR-SPY ETH Mini Wrapper (0x2182)
BR-SPY ETH Mini Wrapper Legacy (0x2183)
BR-SPY ETH 1000T Mini Wrapper (0x2282)
BR-SPY CAN Wrapper (0x2085)
Set time reference(s)
A time reference is the starting point for the next packets time calculations.
It’s possible to set multiple time references in the capture file.
The time references won't be saved permanently and will be lost once the capture file is closed.
To set/unset time references, right click on the chosen packet and click on Set/Unset Time Reference