Signal Graphics
Online mode allows data capture using hardware interfaces. Different interfaces are available from various electronics suppliers such as Vector.
Offline mode allows data logging into trace files to be analyzed.
Note
Note that Signal Graphics implements an ethernet filter (in online ethernet adapters and pcap files) to reduce noisy packets that are not useful (not in the permitted protocols). Currently only packets that fit this filter are allowed in Signal Graphics:
CAN protocol messages sent over:
MediaGateway Hardware (Ethertypes 0x1886 and 0x1887)
BrSpy Hardware (Ethertype 0x2085)
Capture Module Hardware (Ethertype 0x2090)
Raw Can packets (Ethertype 0xCA20)
The Signal Graphics main window:
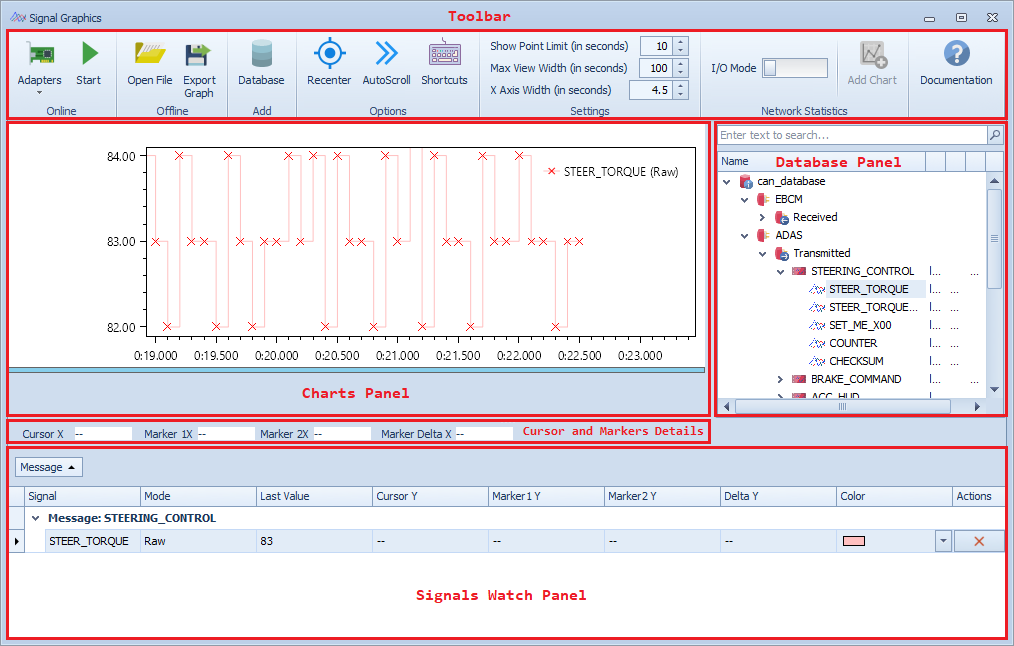
Toolbar
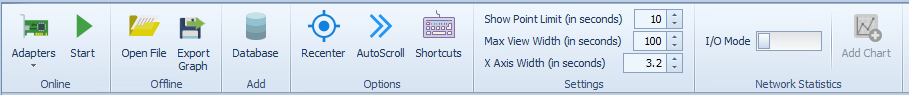
The toolbar contains different commands:
Adapters displays the configured channels and allows to configure new channels from a drop down list of the connected Hardware Interfaces.
- Start/Stop starts/stops online capture.
- To use online mode:
Select one or many channels then click
Startbutton to start capture.Use either Traffic Generator tool or Scripting Environment to generate data.
Select the same message or signal to be dragged and dropped into the chart diagram and the signal chart(s) will be drawn.
- Open File/Stop opens/stops offline capture from trace files.
- Supported files types:
PCAP/PCAPNG/VPCAP.
MDF Bus and Signal logging.
ASCII.
CSV Signal.
- To use offline mode:
Load a trace file.
Select a message or a signal to be dragged and dropped into the chart diagram and the signal chart(s) will be drawn.
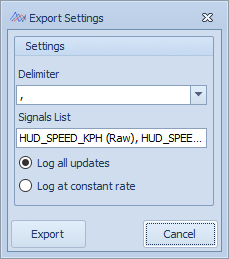
- Export Graph exports current graphs:
- As CSV file:
Choose the delimiter from drop-down list or set a specific one.
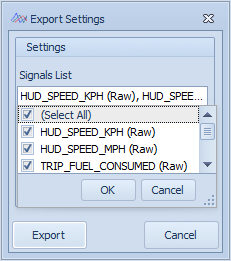
Select the list of the signals to be exported.
Tick either Log all updates or Log at constant rate.
As MDF Signal Logging file: selects exporting all/specific logged signals.
Database loads a database.
Recenter clears zoom, activates auto scroll option and initialize time axis.
AutoScroll goes automatically to the last drawn points.
Shortcuts shows all available keyboard shortcuts.
- Settings sets display settings to the current graphs. This sub menu contains:
Show Point Limit (in seconds): the points will show when the visible range is less than or equals to the specified value which varies between 1 and 60.
Max View Width (in seconds): the maximum visible range of X-axis, it varies between 1 and 600.
X-axis Width (in seconds): the current visible range, it varies between 0.1 and Max View Width value.
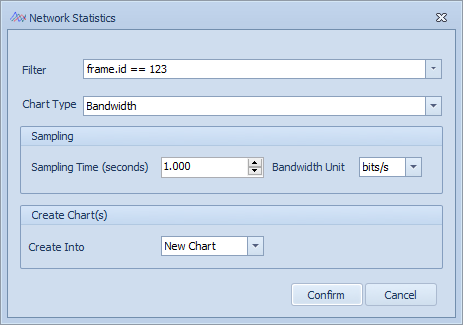
Add Chart adds network statistics to an existing chart or a new one.
Filter: filters packets that are being accepted on the hardware level.
- Chart Type:
Bandwidth: sets the sampling time and bandwidth unit.
Packets per seconds: sets the sampling time.
Delta time
Create Into: specifies whether the new chart will be created on an existing or a separated one.
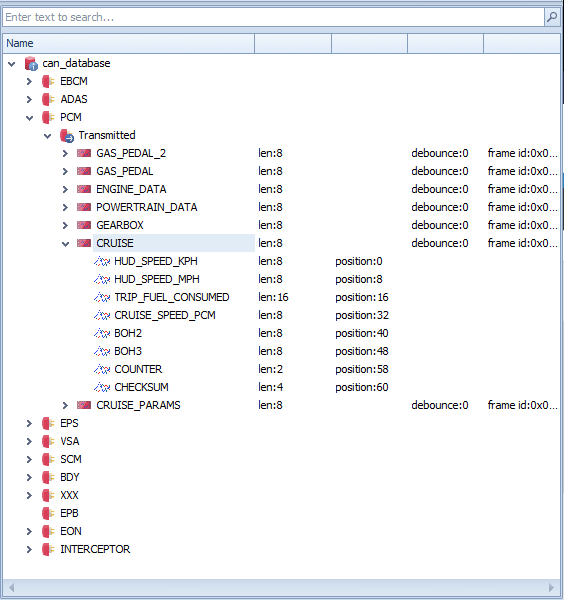
Database Tree
Shows loaded databases.
Deleting one database is done by a right-clicking then clicking Delete button.
Only a message or a signal could be dragged and dropped.
A dragged message or signal can be dropped into either the Charts Panel or the Watch Window.
Charts Panel
Add/Delete chart
To add a chart, drag and drop a signal/message to the Charts Panel:
- Three options are available:
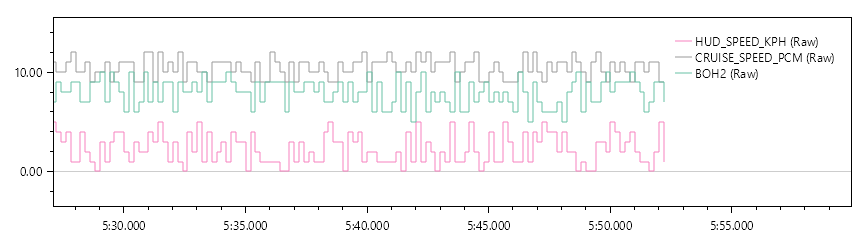
New chart: creates only one new chart containing the dragged signal/message's signals. The X-axis displays the timestamp values and the Y-axis displays the signal value/interpretation.
Existing chart: adds the dragged signal/message's signals to an exiting chart.
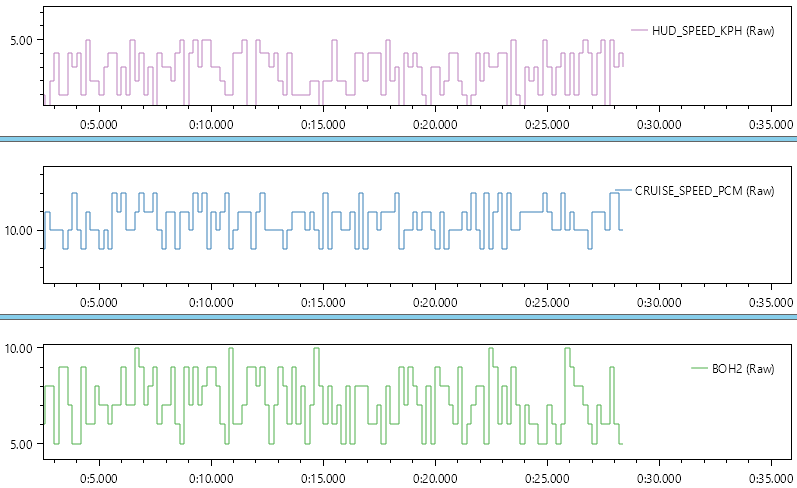
Separate charts: creates charts containing each one a signal from the dragged message. Each chart has its own time-axis and all of them are synchronized.
To delete a chart, do a right-click then select "Delete chart" on the shown context menu.
Show/Hide Interpretations
If a signal has interpretations and it is on a separate chart, the values of Y-axis will be replaced with interpretations. These interpretations can be hidden by right-clicking on the chart then selecting "Hide Interpretation".
Functions
Zoom In/Zoom Out
Signal charts can be magnified or reduced using a mouse wheel on the two axis X and Y. This has an impact on the scale: it can be stretched or compressed.
When the signal curve being shown exceeds the Show Point Limit value the curve will hide the points, and when it is below the range it will show the points.
Panning
Instead of the horizontal scroll bar, a panning option is provided to be able to navigate over the axis. For panning, click, hold and drag.
Markers
Adds a marker at a certain position on the time axis. Markers are represented by a blue vertical line with the current time value and the signal value displayed at the top. One or two markers can be inserted into the chart by a right-clicking on the chart then selecting "Create Marker 1 here" or "Create Marker 2 here" in the shown context menu. When clicking "Show Delta Arrows" in the same menu, an arrow is drawn between the two markers indicating the difference between the time values.
Cursor and Markers details
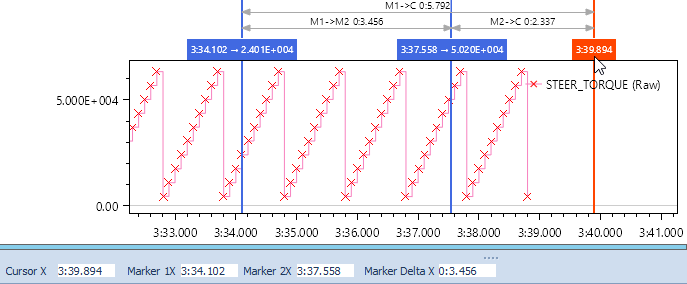
Cursor X: The cursor named "current position cursor" corresponds to the current position of the mouse in the chart. It is represented by an orange vertical line. The value displayed at the top of the cursor represents the current time value and the signal value. In separate mode, each partial chart has its own current position cursor and all cursors are synchronized.
Marker 1X: The position of Marker 1.
Marker 2X: The position of Marker 2.
Marker Delta X: The difference between markers values.
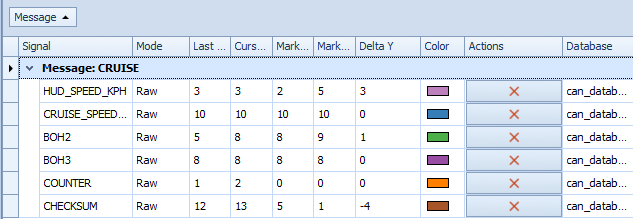
Signals Watch Panel
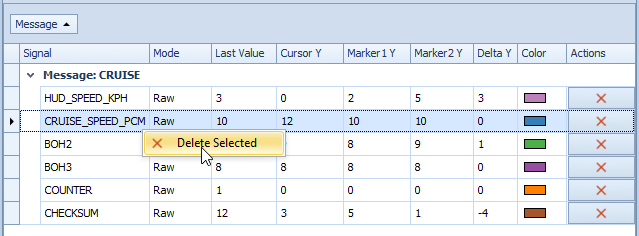
Message shows the message parent of the signal, by default the signals are grouped by their message as shown below.
Signal shows the signal name.
Mode shows the value mode. It is either Raw or Physical.
Last Value shows the last captured value of the signal.
Cursor Y shows the signal value at the mouse cursor. The signal value takes "--" when mouse pointer is out of the panel's bounds.
Marker1 Y shows the signal value corresponding to the first Marker. It is the intersection between the Marker 1 and the projection of the curve on Y-axis which indicates signal value.
Marker2 Y shows the signal value corresponding to the second Marker.
Delta Y indicates the difference between the two previous values.
Color shows the signals curve color. The color can be changed by clicking color's rectangle and choosing a new one.
Actions contains a delete button for the signal's chart.
Database the database name of which the signal is a part of, this column is hidden by default and needs to be enabled through the watch window menu.
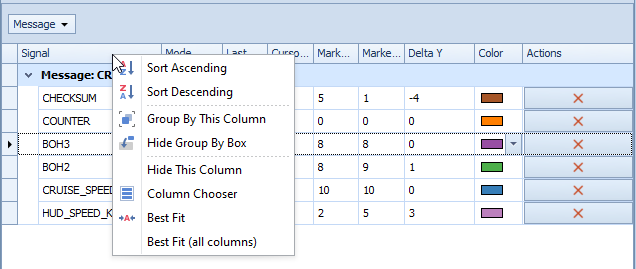
Sort allows to sort the signals based on the values of the selected column, the column that was right clicked, sorting can be ascending or descending.
Clear All Sorting allows to clear all the sorting that was done and showing the signals in the order they were added in.
Group By This Column allows grouping based on the selected column. Grouping is based on the columns database, message, and signal. To ungroup signals, right click the grouping column (by default message) and the click Ungroup on the shown context menu.
Hide Group By Box allows to show/hide the grouping column.
Hide This Column hides the selected column.
Column Chooser opens the panel that allows hiding/showing columns as explained below.
Best Fit resizes the selected columns to the best fit possible (that shows all the values of the column in the best way possible).
Best Fit (all columns) resizes all of the visible columns to the best fit possible for all columns.